In the present Case Analysis, the main topic that is going to be addressed is the evolution of the company Ferrari N.V.’s stock price since its Initial Public Offering, in which it is included the kind of business and Fundamental Analysis. Ferrari NV, known as Ferrari, is an Italy-based designer, manufacturer and retailer of sports cars that is incorporated in the Netherlands. It operates under the Ferrari brand. Its sports cars portfolio includes, among others, F12berlinetta, FF, Ferrari 488 GTB, 488 Spider, 458 Speciale, Ferrari California T, F12tdf and LA Ferrari. The Company also offers financing services through Ferrari Financial Services. It also produces limited series and one-off cars. The Company divides its regional markets in EMEA (Europe, the Middle East, India and Africa), Americas, Greater China and Rest of APAC (Asia-Pacific region, excluding Greater China) and is active in over 60 markets worldwide through a network of authorized dealers (Nasdaq, 2019).
Kind of Business Ferrari
Ferrari N.V. licenses the Ferrari brand to a select number of producers and retailers of luxury and lifestyle goods, the company sell Ferrari-branded merchandise through a network of 20 franchised and 12 owned Ferrari stores and on its website. As one of the world’s most recognized premium luxury brands, it believes the company is well positioned to selectively expand the presence of the Ferrari brand in attractive and growing lifestyle categories consistent with its image, including sportswear, watches, accessories, consumer electronics and theme parks which it believes enhance the brand experience of it loyal following of clients and Ferrari enthusiasts. (Nasdaq, 2019).
Initial Public Offering Analysis of Ferrari
The state in which Ferrari N.V. was incorporated was Amsterdam, its employees as of 12/31/2014 where 2858. On the other hand, the company was listed in the New York Stock Exchange priced on 10/21/2015 offering 17,175,000 stocks with a share price of $52 hence the offer amount was $893,100,000. Ferrari N.V. This is an initial public offering of common shares of Ferrari N.V. (“Ferrari”). Fiat Chrysler Automobiles N.V. (“FCA”) is selling 17,175,000 common shares of Ferrari, equal to approximately 9 percent of the Ferrari share capital (FCA, 2019). Ferrari N.V. was not selling common shares and it will not receive any of the proceeds from the sale of common shares by FCA. Prior to this offering, there has been no public market for its common shares (Ferrari, 2019). On the other hand, In the sports car segment Ferrari N.V.’s products, are the 488 GTB, 488 Spider, 458 Italia, 458 Spider, 458 Speciale, 458 Speciale Aperta and F12berlinetta and its principal competitors are Lamborghini (Huracán and Aventador), McLaren (650S), Porsche (911 Turbo and Turbo S), Mercedes (SL 63/65 AMG), Aston Martin (Vanquish and V12 Vantage/ S) and Audi (R8 V10). In the GT segment our products are the California T and FF models and our principal competitors are Rolls-Royce (Wraith), Bentley (Cont. GT/GTC, V12 and V8 (Speed and S version), GT3-R), Aston Martin (DB9) and Mercedes Benz (CL 63/65 AMG, S Coupé 63/65 AMG) (Nasdaq, 2019).
In terms of Ferrari N.V.’s employees, by 12/03/2019 the company had 3587 employees which represents an increase of 25.51% from October 2015 to 12/03/2019. On the other hand, the average monthly returns of the company from the last two years were lower than the average monthly returns of the S&500 Index: the average returns were 0.45% and 0.76% respectively, the standard deviation of the monthly returns of Ferrari N.V. from the last two years was lower than the S&500 Index (3.49% from Ferrari N.V. and 3.60% from the S&500 Index); this means that the monthly returns from the las two years of Ferrari N.V. were less deviated from its average. In order to measure the variations of the monthly returns from the last two years in relation to the mean, the coefficient of variation was calculated which was 773.04% for Ferrari N.V. and 474.83% for the S&500 Index; this means that there was more dispersion in the Ferrari N.V.’s monthly returns from the last two years than those of the S&500 Index hence the best relationship in terms of risk and return was for the S&500 Index (global). The share price of Ferrari N.V. by 12/03/2019 was $131.76, this means that from October 2015 to 12/03/2019 the company’s share price increased 153.38%, although the shares outstanding and the market capitalization from October 2015 to 12/03/2019 increased 1327.30% and 3516.56% respectively.
Fundamental Analysis
Ferrari N.V.’s Share performance
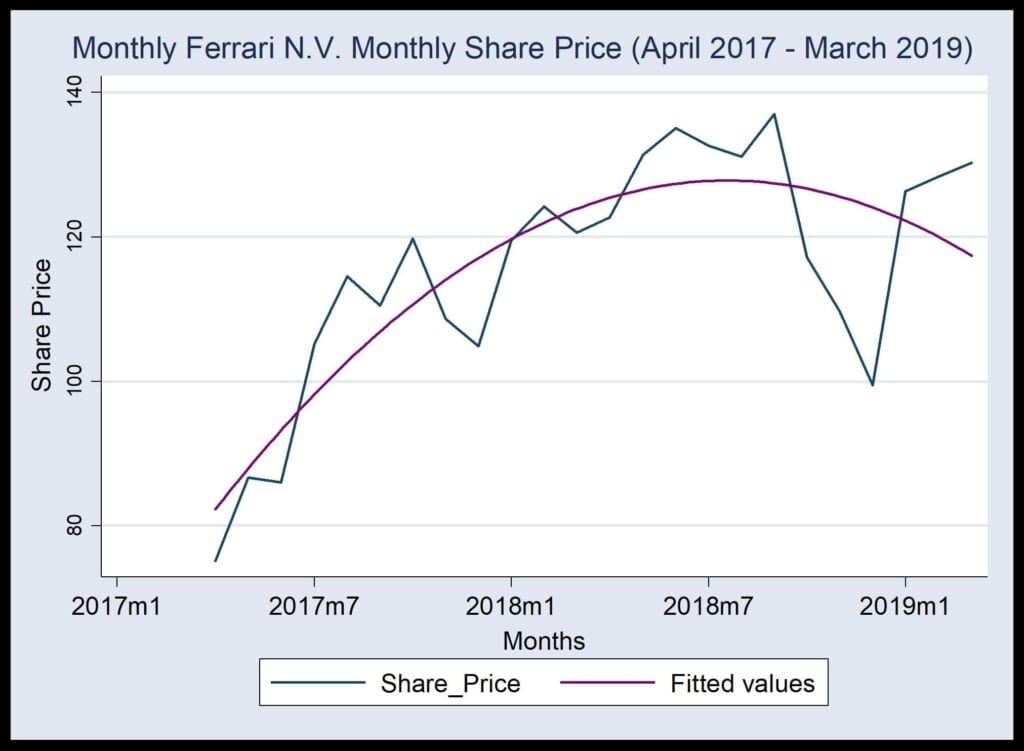
Ferrari Shares Performance
From the Stock Chart it can be seen that the behavior of the Ferrari N.V.’s monthly stock prices (April 2017-March 2019) is heteroscedastic, and it cannot be seen cyclical fluctuations, on the other hand; a possible increasing trend can be observed: it seems that the stock prices are moving upward in a coordinated way over time. On the other hand, it could be possible that the company’s stock prices could be changing its trend.
Earnings per share
Ferrari N.V.’s relationship between the current market price of the stock and its earnings per share in the third quarter of 2018 was 1.17, it means that Ferrari N.V.’s common stock is selling in the market place for 1.17 times its earnings; the expected earnings per share of analysts for the third quarter of 2018 was 1.15. Analysts could have expected a lower earnings per share than the real value because they estimated a higher value for the shares outstanding than the real one, another possibility is that they estimated a lower value for the net income than the real value.
Income Statement
| Period Ending | 30/09/2018 | 30/06/2018 | 31/03/2018 | 31/12/2017 |
| Revenues | 838.18 | 905.65 | 831.00 | 839.90 |
| Gross profit | 437.19 | 474.22 | 440.23 | 440.70 |
| Operating Income | 203.12 | 218.25 | 209.93 | 194.22 |
| Net Income | 286.92 | 160.27 | 147.63 | 135.64 |
| Total Assets | 4,614.76 | 4,379.48 | 4,360.69 | 4,141.10 |
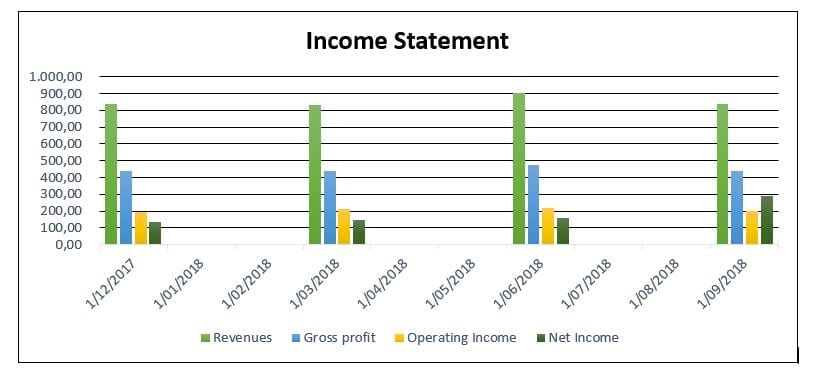
Ferrari Income Statement
| Profitability Ratios | 30/09/2018 | 30/06/2018 | 31/03/2018 | 31/12/2017 |
| Gross Margin (GP / Rev) | 52.16% | 52.36% | 52.98% | 52.47% |
| Operating Margin (Op Inc / Rev) | 24.23% | 24.10% | 25.26% | 23.12% |
| Net profit Margin (Net Inc / Rev) | 34.23% | 17.70% | 17.77% | 16.15% |
| Return on Investment (Net Inc / Assets) | 6.22% | 3.66% | 3.39% | 3.28% |
The percentage of total sales revenue that Ferrari N.V. retains after incurring the direct costs of associated with producing the goods and services it sells in the third quarter of 2018 is expressed as 52.16%, this means that after Ferrari N.V. pays off its inventory costs, it still has 52.16% of its sales revenue to cover its operating costs. The profit that Ferrari N.V. retains after removing operating expenses (such as cost of goods sold and wages) and depreciation is expressed as 24.23%, this means that there remain 0.2423 cents to cover all none-operating costs. The percentage of each sales dollar, on average, that represents income of Ferrari N.V. is 34.23%. After all expenses and taxes have been paid, the company was able to produce a profit margin of 34.23% of sales. The measure of how effectively a company can earn a return on its investment in assets is expressed as the percent rate of Return on Investment, in the case of Ferrari N.V. is 6.22%; it means that every dollar invested by Ferrari N.V. in assets, generates 6.22% of net income.
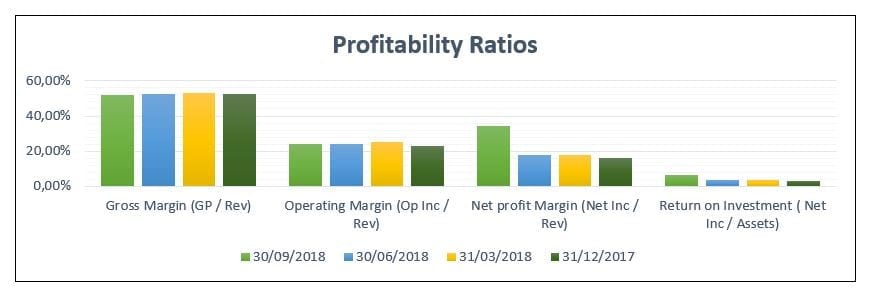
Ferrari Profitability Ratios
Balance Sheet
| Period Ending | 30/09/2018 | 30/06/2018 | 31/03/2018 | 31/12/2017 |
| Total Assets | 4,614.76 | 4,379.48 | 4,360.69 | 4,141.10 |
| Total Liabilities | 3,388.71 | 3,455.35 | 3,466.51 | 3,362.43 |
| Total Equity | 1,226.05 | 924.13 | 894.18 | 778.67 |
| Total Current Assets | 2,392.88 | 2,216.96 | 2,244.27 | 2,081.08 |
| Total Current Liabilities | 1,170.95 | 1,276.62 | 1,312.92 | 1,214.21 |

Ferrari Balance Sheet
| Balance Sheet Ratios | 30/09/2018 | 30/06/2018 | 31/03/2018 | 31/12/2017 |
| LT Debt to Equity | 180.89% | 235.76% | 240.85% | 275.88% |
| Debt to Equity | 276.39% | 373.90% | 387.67% | 431.82% |
| Assets Turnover (Revenues / Assets) | 18.16% | 20.68% | 19.06% | 20.28% |
| Current Ratio (Curr. Assets /Curr. Liab) | 204.35% | 173.66% | 170.94% | 171.39% |
The measure of how much debt Ferrari N.V. is using to finance its assets relative to the value of shareholder’s equity is expressed as 180.89%, this means that there are 180.89% more liabilities than there is equity. The indicator of efficiency in which Ferrari N.V. is deploying its assets in generating revenue is expressed as 18.16, this means that Ferrari N.V.’s inventory turns 18.16 times a year. Ferrari N.V.’s ability to pay current debts as they become due is expressed as 2.0435, this means that for every two dollars of current liabilities, Ferrari N.V. has $0.0435 of current assets to pay those obligations.
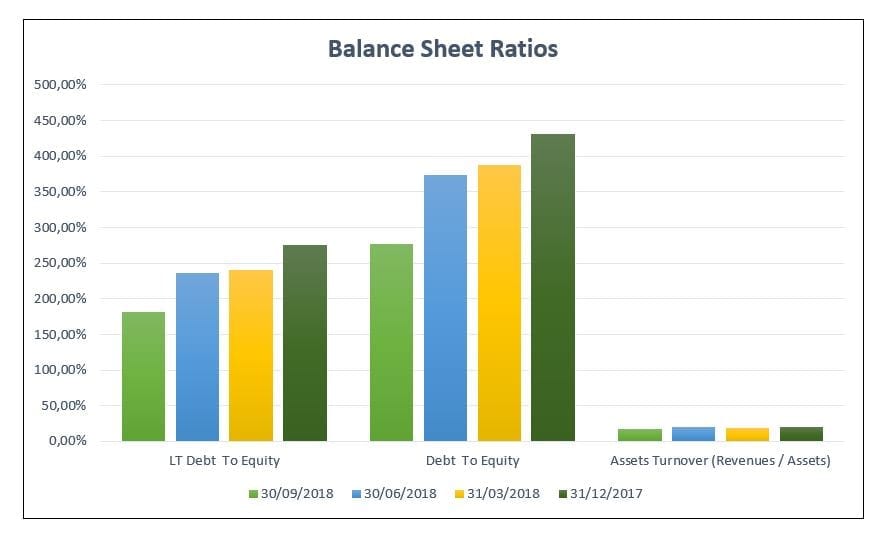
Ferrari Balance Sheet Ratios
Bibliography
Ferrari Corporate. (2019). Retrieved from http://corporate.ferrari.com/en
Nasdaq. (2019). Retrieved from https://www.nasdaq.com/markets/ipos/company/ferrari-nv-971252-79019
IPO Process – A Guide to the Steps in Initial Public Offerings (IPOs). (2019). Retrieved from https://corporatefinanceinstitute.com/resources/knowledge/finance/ipo-process/
